Road to Management Information for Water and Sanitation in Myanmar
A 3-month successful mission on Management Information between VEI Dutch Water Operators & Mandalay City Development Committee took place in November as part of WaterWorX program
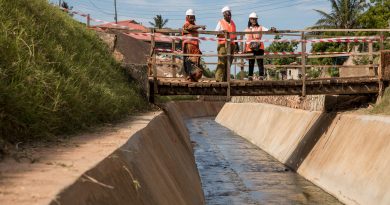
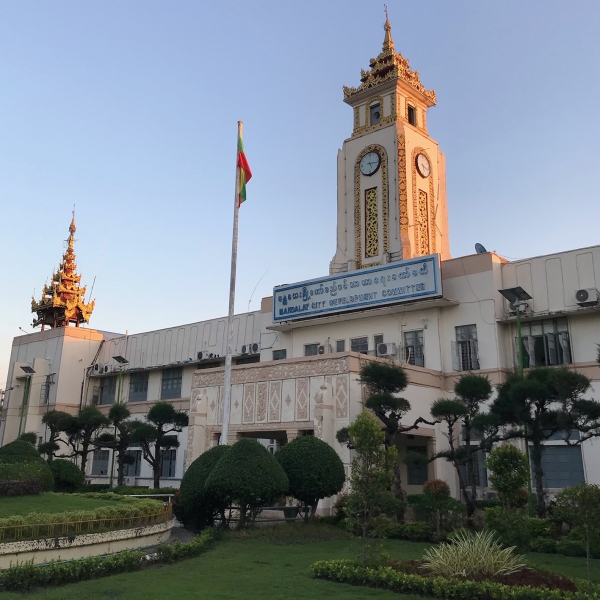
The Mandalay City Development Committee (MCDC) is the administrative body of Mandalay, the second largest city in Myanmar. The municipality has the Water and Sanitation department (WSD) as one of its responsibilities, tasked with supplying water and sanitation to the population of Mandalay, now estimated at almost 1.5 million.
The department struggles to carry out its responsibilities effectively because it lacks staff, capacities, skills, funds, and data. As WSD is not a ringfenced water company – for example, the billing and collection process is not part of WSD – there is a lot of fragmented information. On top of that there is a very low level of digitalization. Computers are still rarely used, and information is mostly recorded on paper.
WOP Activities
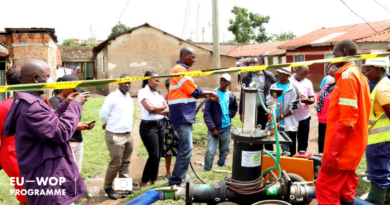
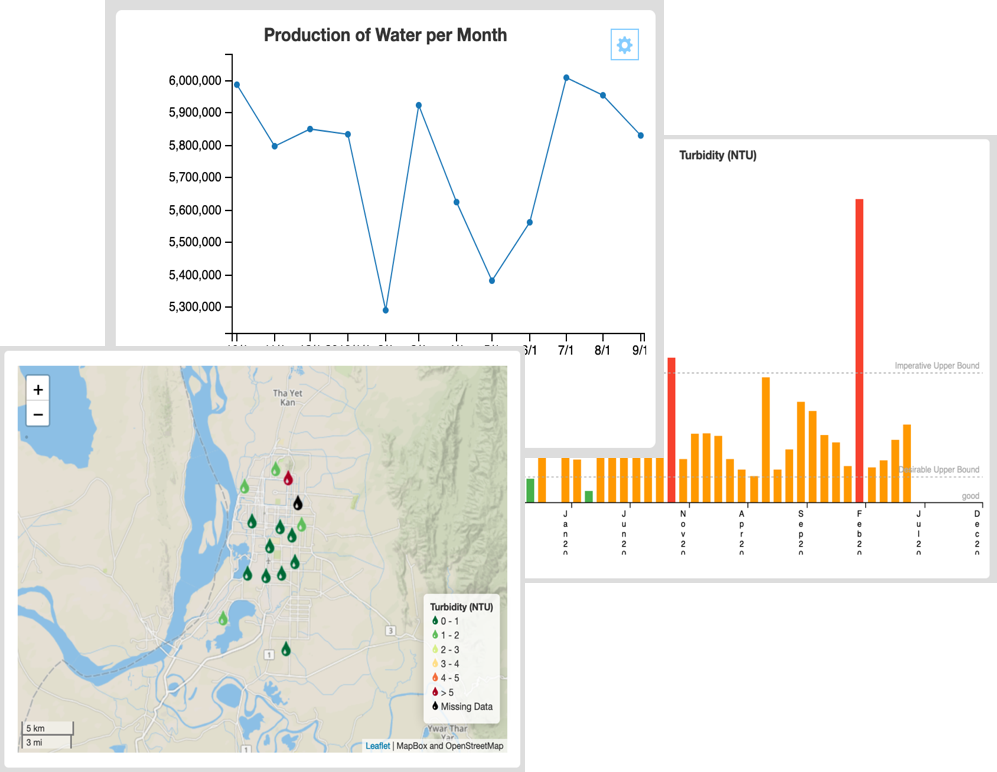
In this context, the WOP between VEI and MCDC focused on Management Information using the mWater app to create survey’s where MCDC staff can more easily collect and record data. This data in turn is summarized visually for all to see. It records, stores and visualizes information that otherwise would be collected and reported on paper.
The mWater tool is originally designed to enable the easy recording of survey information. These surveys can be technical (e.g. leak detection) or social (HH survey’s). The app enables the use of most smartphones to log coordinates and photos and many people can work simultaneously in the same database. The offline functionality also enables use in areas with bad coverage.
Forms were designed by MDY WWX to record per production location:
- Water quality parameters
- Energy use
- Production capacity
- Asset information
For MCDC as a whole also forms were made to record per township:
- Revenue
- Water use
- Number of connections
- Number of private wells
- Pipe leakages
The results can be shown as a summary for the whole of WSD, or per production location. As map, as graph or as table and are interactive when using the desktop version.
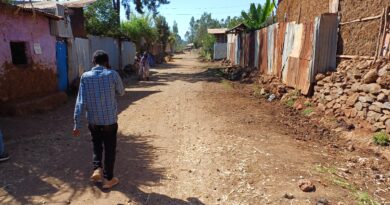
As part of the watersafetyplan inventory the mWater app was used to record – and take pictures of – the different risks, the number of pumps, reservoirs and other assets. Based on the recorded assets, flowcharts of every production location were drawn and added to the survey per production location. This also included the capacity of the assets. The risk scores of every risk (microbiological, chemical, physical and human) can then both be plotted on a map and shown in a list, with a mark if the risk is mitigated or not.
Results
The results of the 3-week missions were presented to the management of WSD who were impressed with the result and the new ways this enables them to look at their data.
VEI and WSD agreed upon creating a “data-team” of WSD employees who will have the responsibility of keeping the information up to date, improve the data quality and amount of data and expand the types of data shown. WSD committed to invest in a central computer with TV screen which will enable them to show the data to employees without access to computer as well.
Stimulating all to record the data, but more important; create awareness, insight and transparency throughout the organization.
WaterWorX aims to increase sustainable access to drinking water to 10 million people in 2030. Through Water Operator Partnerships (WOPs) between Dutch and local water companies, WaterWorX is working on long term sustainable water services by improving operation and maintenance of the local water companies and getting their finances in order.